Home
MT4 Indicators
MT5 Indicators
Trading Systems
Courses
Books
Forex Signals
Shop
No Result
View All Result
Contact Us
Home
MT4 Indicators
MT5 Indicators
Trading Systems
Courses
Books
Forex Signals
Shop
No Result
View All Result
No Result
View All Result
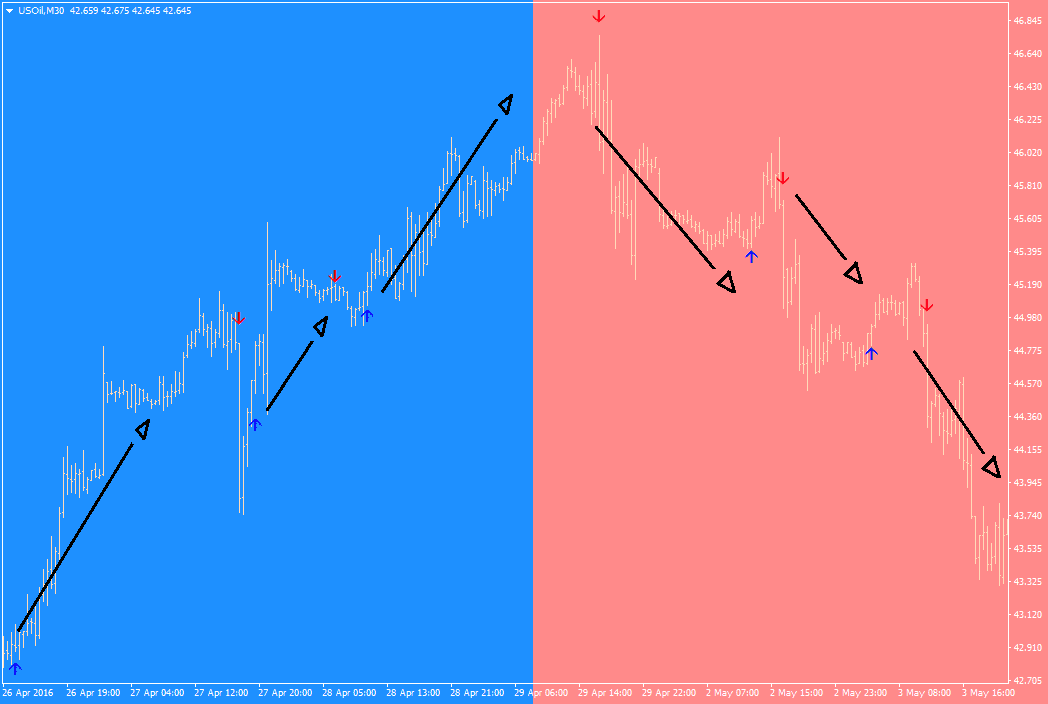
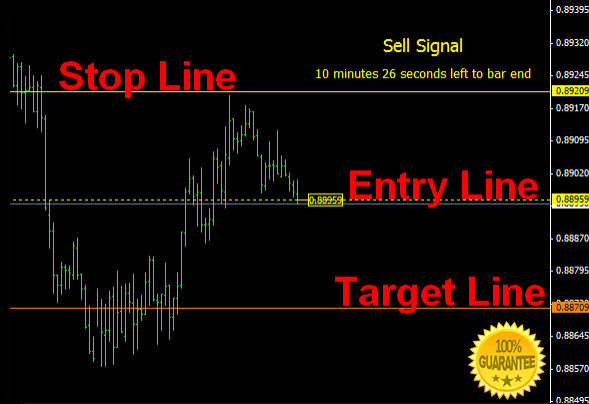
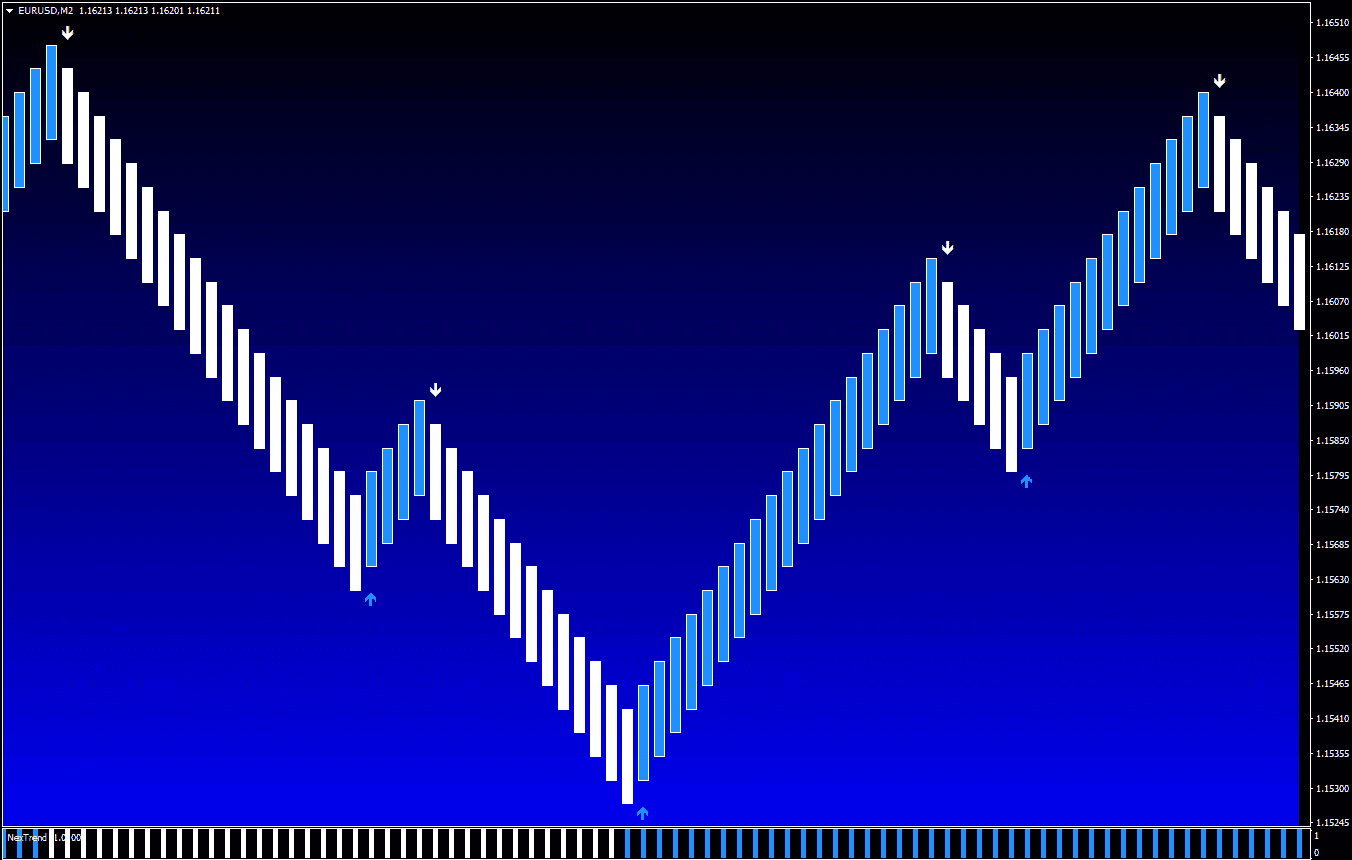
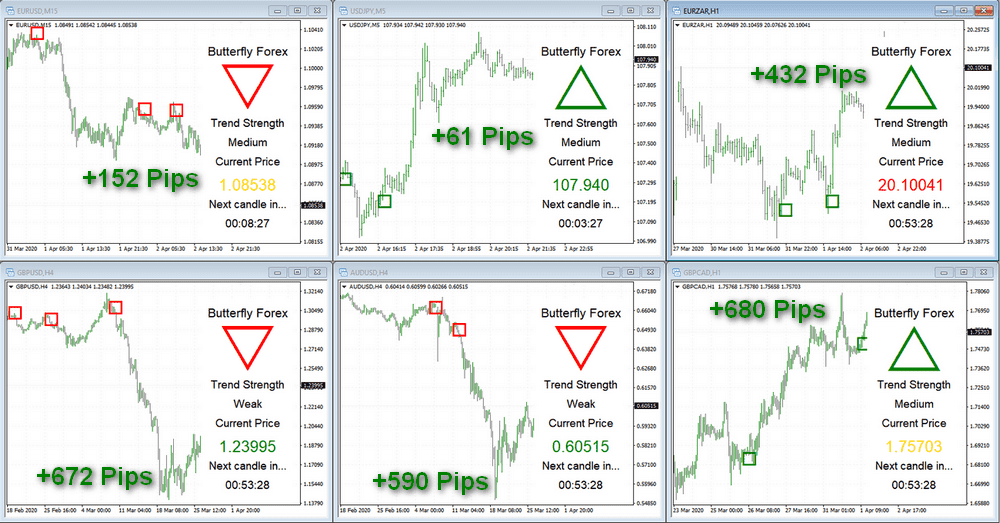
BUTTERFLY FOREX MT4 TRADING SYSTEM
Share
Tweet
Pin
17
Share
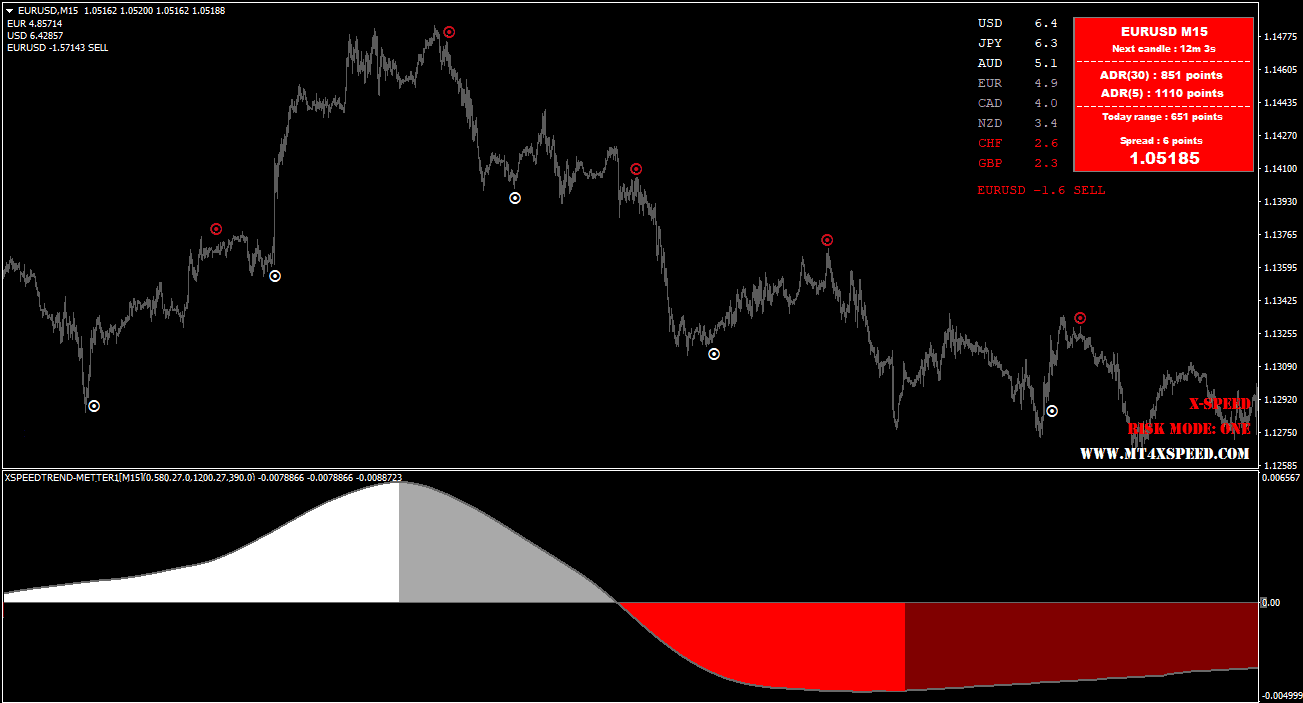
X Speed Mt4 Software
Share
Tweet
Pin
31
Share
Download NitroFX Forex Trading System
Share
Tweet
Pin
74
Share
ATR Channels Mt5 Indicator
Share
Tweet
Pin
5
Share
Price Grid Mt5 Indicator
Share
Tweet
Pin
5
Share
Givonly SnR SnD Mt5 Indicator
Share
Tweet
Pin
5
Share
Slope Direction Line Mt5 Indicator
Share
Tweet
Pin
5
Share
Trend CCI Mt5 Indicator
Share
Tweet
Pin
5
Share
Page 1 of 423
1
2
…
423
Next
Premium Forex Indicators
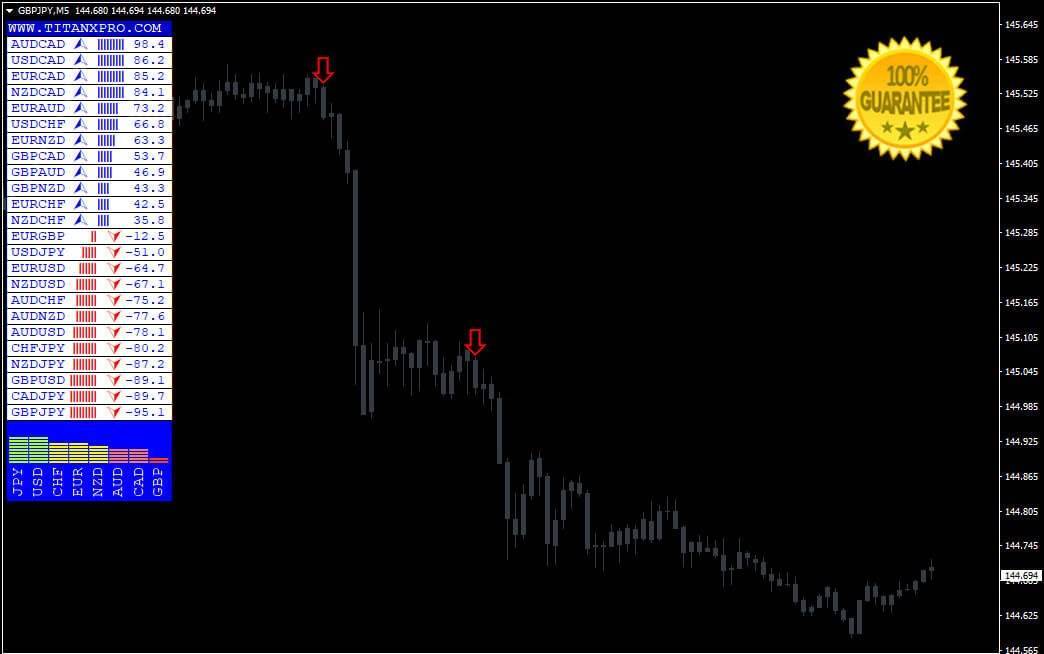
Download Titan Pro Dashboard Mt4 Indicator
Scalper Scanner Mt4 Indicator
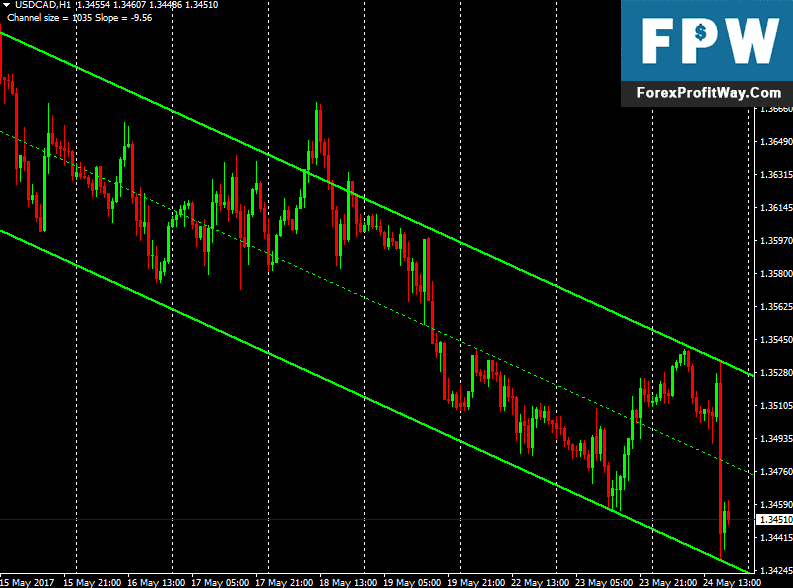
Download Channel True V2 Forex Indicator For Mt4
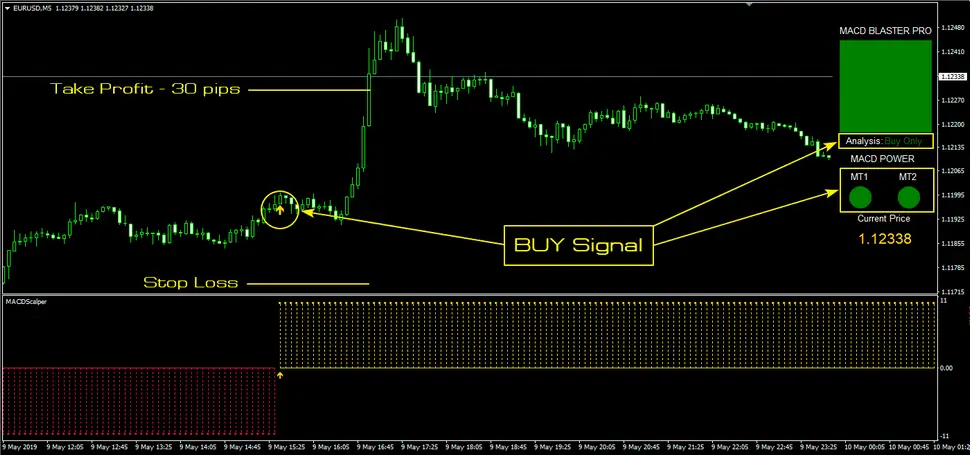
MACD BLASTER PRO TRADING SYSTEM MT4
Download Stochastic Signals Forex Indicator For Mt4
Cougar FX System
Download Auto Trade Fusion Automate Signals Forex Indicator For Mt4
Download NitroFX Forex Trading System
No Result
View All Result
Home
MT4 Indicators
MT5 Indicators
Trading Systems
Courses
Books
Forex Signals
Shop
© 2015-2024 Forex Profit Way is a big hub for best forex indicators, trading systems, courses, etc.